Environmental Product Declaration
HSS Tube and Pipe
by Nova Tube, Inc.
Environmental Product Declaration (EPD) for HSS Tube and Pipe, manufactured by Nova Tube, Inc.. Declaration SmartEPD-2025-063-0473-01, prepared according to UL Part B: Designated Steel Construction Products, valid until April 23, 2030.
Download the EPD (PDF)
- Declared unit
- 1 metric ton of product of steel construction product
- Valid until
- April 23, 2030
- PCR
- UL Part B: Designated Steel Construction Products
Declaration details
- Manufacturer
- Nova Tube, Inc.
- Program operator
- Smart EPD
- Declaration number
- SmartEPD-2025-063-0473-01
- Date of issue
- April 23, 2025
- Valid until
- April 23, 2030
- Product category rules (PCR)
- UL Part B: Designated Steel Construction Products (version 2)
- Standard
- ISO 14025:2006 and ISO 21930:2017
- Declared unit
- 1 metric ton of product of steel construction product
- System boundary
- Cradle to gate (A1 - A3)
- Product specificity
- Product Average
- Manufacturing specificity
- Manufacturer Average, Facility Specific
- Manufacturing plants
- St. Patrick (5870 Saint-Patrick St., Montreal, Quebec H4E 1S8, Canada); Baie-D'Urfe (19460 Clark Graham Ave, Baie-D'Urfe, Quebec H9X 3R8, Canada); Delta, Ohio (8641 Co Rd H, Delta, OH 43515, USA)
- Product category
- Steel › StructuralSteel › HollowSections
- Verifier
- Lucas Pedro Berman, Senda - Consultoria Ambiental & Energetica
- LCA software
- openLCA 2.0
- Program instructions
- Smart EPD General Program Instructions v.2.0, March 2025
Life cycle assessment results
Results per 1 metric ton of product of steel construction product.
Environmental Impact Assessment Results
Resource Use Indicators
Waste and Output Flow Indicators
ND = not declared. Life cycle modules: A1-A3 product stage, A4-A5 construction process, B use stage, C end of life, D benefits and loads beyond the system boundary.
Material composition
Hazardous substances
No regulated hazardous or dangerous substances are included in this product.
Product description
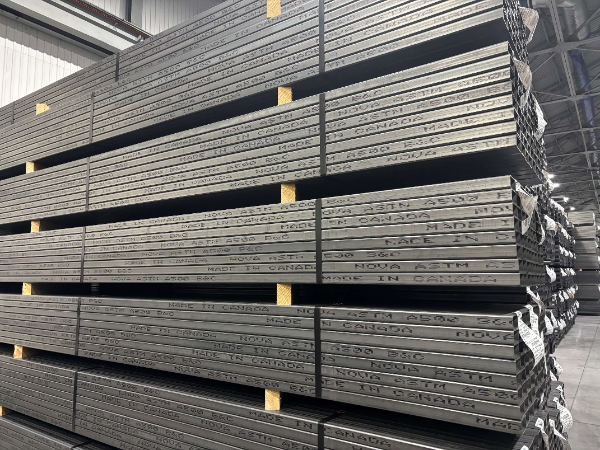
The HSS tube and pipe products analyzed in this study are made of mainly carbon steel with a small percentage of alloy elements and paints included. The product has a density of approximately 7,850 kg/m3. Nova Tube’s HSS tube and pipe products are typically produced by cold-forming and welding processes to form round, square, or rectangular shapes with various dimensions and lengths. HSS are typically used in buildings, and other structures.
Interpretation
The LCA results indicate that the steel coil input is the largest contributor to the individual site results and the production-weighted average HSS and pipe products across all impact categories for Ohio facility. For the Canadian facilities, St. Patrick and Baie-d’Urfè, steel coil is the dominant contributor in all categories except for ODP. The HSS and pipe products produced at the Ohio site have a higher GWP footprint (1,802 kgCO2e/MT) than those of Baie-d’Urfè (1,629 kgCO2e/MT) and St. Patrick (1,677 kgCO2e/MT), respectively. At the St. Patrick, Baie-d’Urfè, and Ohio sites, steel inputs represent 91%, 94%, and 98%, respectively, of the total cradle-to-gate GWP footprint. The A1 stage is the highest contributing life cycle stage to GWP, AP, SFP, and ADPfossil for the products produced at St. Patrick. The A1 stage is the highest contributing stage to GWP, AP, EP, SFP, and ADPfossil for the products produced at the Baie-d’Urfè site. The A1 stage is the highest contributing life cycle stage to all LCIA impact categories for the products produced at the Ohio site. The production weighted average HSS and pipe product has a GWP of 1,698 kgCO2e/MT, and is contributed most significantly by the A1 stage, representing 83% - 94% of each LCIA impact category.
The results of the LCIA indicate that the potential environmental impacts for the HSS products are driven by steel coil raw material input. Inbound transport of raw materials (A2) also have a modest contribution at St. Patrick and Baie-d’Urfè sites. Manufacturing stage (A3) was the second major contributor to all impact categories at the Delta, Ohio site.
LCIA results are relative expressions and do not predict impacts on category endpoints, the exceeding of thresholds, safety margins or risks. EPDs are comparable only when they follow the same PCR, functional unit and system boundary. The full EPD (PDF) contains the methodology, scenario assumptions and verification statement.
