
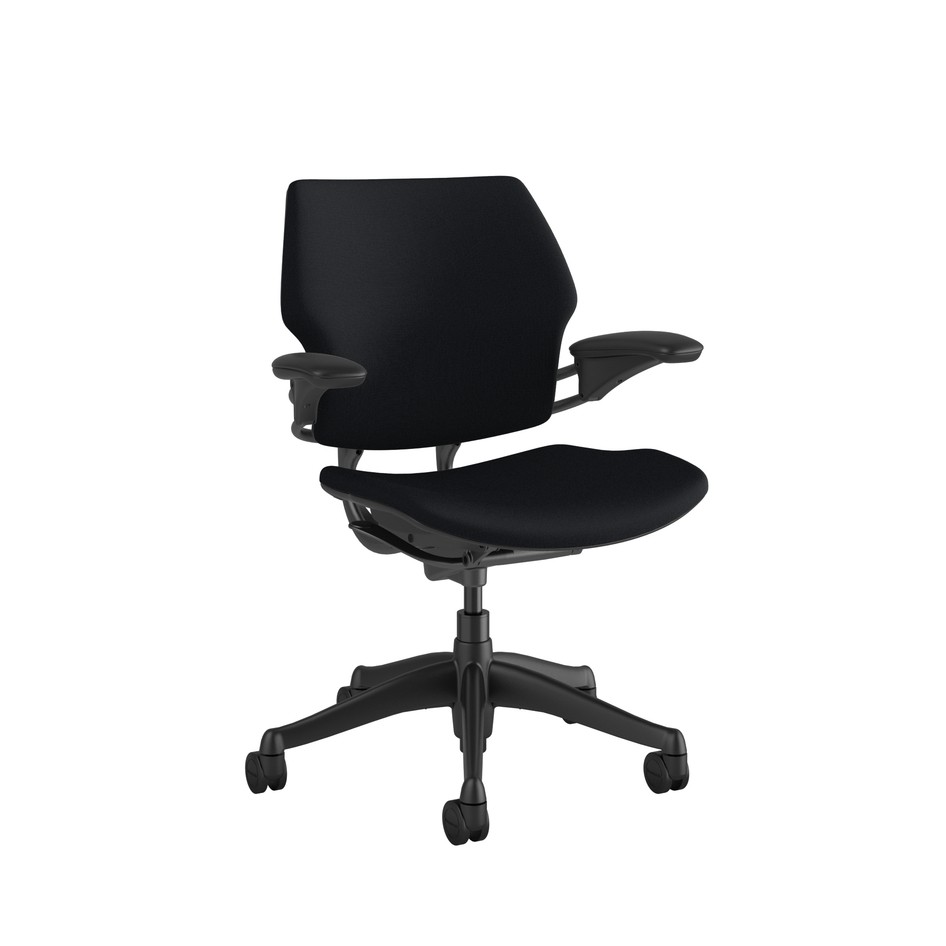
Environmental Product Declaration
Freedom Task
by Humanscale
Environmental Product Declaration (EPD) for Freedom Task, manufactured by Humanscale. Declaration SmartEPD-2026-082-1126-01, prepared according to NSF BIFMA PCR for Seating: UNCPC 3811 v4, valid until November 2, 2031.
- Functional unit
- 1 Unit of product of seating
- Valid until
- November 2, 2031
- PCR
- Furnishings v4
Declaration details
- Manufacturer
- Humanscale
- Program operator
- Smart EPD
- Declaration number
- SmartEPD-2026-082-1126-01
- Date of issue
- November 2, 2026
- Valid until
- November 2, 2031
- Product category rules (PCR)
- NSF BIFMA PCR for Seating: UNCPC 3811 v4
- Standard
- ISO 14025:2006 and ISO 21930:2017
- Functional unit
- 1 Unit of product of seating
- System boundary
- Cradle to gate with other options (A1 - A3, A4, A5, B1, B4, C1 - C4)
- Product specificity
- Product Specific
- Manufacturing specificity
- Facility Specific
- Manufacturing plant
- Humanscale Piscataway (220 Circle Drive North, Piscataway, NJ, USA)
- Product category
- Furnishings › Chairs
- Product SKU
- F111GCF10XFSHNSC
- Product service life
- 10 years
- Verifier
- Jack Geibig, Ecoform, LLC
- LCA software
- Carbon Bright 1.2.2
- Program instructions
- Smart EPD General Program Instructions v.2.0, March 2025
Life cycle assessment results
Results per 1 Unit of product of seating.
Environmental Impact Assessment Results
| Indicator | Unit | A1-A3 | A4 | A5 | B1 | B4 | C1 | C2 | C3 | C4 |
|---|---|---|---|---|---|---|---|---|---|---|
| climate change: total (EF v3.1 - IPCC 2021)global warming potential (GWP100) | kg CO2-Eq | 8.66e+1 | 3.72e+0 | 5.86e+0 | 0 | 0 | 0 | 8.08e-2 | 3.85e+0 | 5.46e-1 |
| climate change: biogenic (EF v3.1 - IPCC 2021)global warming potential (GWP100) | kg CO2-Eq | -4.52e+0 | 0 | 4.52e+0 | 0 | 0 | 0 | 0 | 0 | 0 |
| climate change: total excluding biogenic (EF v3.1 - IPCC 2021)global warming potential (GWP100) | kg CO2 eq | 9.11e+1 | 3.72e+0 | 1.34e+0 | 0 | 0 | 0 | 8.08e-2 | 3.85e+0 | 5.46e-1 |
| ADP-fossilabiotic depletion potential (ADP): fossil fuels | MJ, net calorific value | 1.30e+3 | 5.23e+1 | 6.15e+0 | 0 | 0 | 0 | 1.13e+0 | 6.27e+0 | 2.13e+0 |
| acidificationacidification potential (AP) | kg SO2-Eq | 5.56e-1 | 1.55e-2 | 1.26e-3 | 0 | 0 | 0 | 3.37e-4 | 3.63e-3 | 7.82e-4 |
| eutrophicationeutrophication potential | kg N-Eq | 5.90e-1 | 5.74e-3 | 1.33e-2 | 0 | 0 | 0 | 1.25e-4 | 5.78e-3 | 2.53e-1 |
| ozone depletionozone depletion potential (ODP) | kg CFC-11-Eq | 1.22e-6 | 5.21e-8 | 2.13e-9 | 0 | 0 | 0 | 1.13e-9 | 7.68e-9 | 2.50e-9 |
| photochemical oxidant formationmaximum incremental reactivity (MIR) | kg O3-Eq | 6.88e+0 | 4.19e-1 | 1.60e-2 | 0 | 0 | 0 | 9.10e-3 | 1.05e-1 | 1.69e-2 |
Resource Use Indicators
| Indicator | Unit | A1-A3 | A4 | A5 | B1 | B4 | C1 | C2 | C3 | C4 |
|---|---|---|---|---|---|---|---|---|---|---|
| total use of non-renewable primary energy resources (primary energy and primary energy resources used as raw materials)PENRT | MJ | 1.31e+3 | 5.23e+1 | 6.15e+0 | 0 | 0 | 0 | 1.13e+0 | 6.27e+0 | 2.13e+0 |
| total use of renewable primary energy resources (primary energy and primary energy resources used as raw materials)PERT | MJ | 9.20e+1 | 7.49e-1 | 7.94e-1 | 0 | 0 | 0 | 1.63e-2 | 6.44e-1 | 3.67e-2 |
| use of non-renewable primary energy excluding non-renewable primary energy resources used as raw materialsPENRE | MJ | 1.06e+3 | 5.23e+1 | 5.79e+0 | 0 | 0 | 0 | 1.13e+0 | -7.69e+1 | -1.80e+2 |
| use of non-renewable primary energy resources used as raw materialsPENRM | MJ | 2.50e+2 | 0 | 3.60e-1 | 0 | 0 | 0 | 0 | 8.32e+1 | 1.82e+2 |
| use of non-renewable secondary fuelsNRSF | MJ | 0 | 0 | 0 | 0 | 0 | 0 | 0 | 0 | 0 |
| use of renewable primary energy excluding renewable primary energy resources used as raw materialsPERE | MJ | 5.12e+1 | 7.49e-1 | 0 | 0 | 0 | 0 | 1.63e-2 | 6.44e-1 | 3.67e-2 |
| use of renewable primary energy resources used as raw materialsPERM | MJ | 4.08e+1 | 0 | 4.56e+1 | 0 | 0 | 0 | 0 | 0 | 0 |
| use of secondary materialSM | kg | 8.52e+0 | 0 | 0 | 0 | 0 | 0 | 0 | 0 | 0 |
| use of renewable secondary fuelsRSF | MJ | 4.50e-1 | 2.95e-4 | 1.20e-5 | 0 | 0 | 0 | 6.41e-6 | 4.35e-5 | 1.39e-5 |
| net use of fresh waterFW | m3 | 5.98e-1 | 7.39e-3 | 4.23e-4 | 0 | 0 | 0 | 1.60e-4 | 4.57e-3 | -2.75e-2 |
| RE | MJ | 0 | 0 | 0 | 0 | 0 | 0 | 0 | 0 | 0 |
Waste and Output Flow Indicators
| Indicator | Unit | A1-A3 | A4 | A5 | B1 | B4 | C1 | C2 | C3 | C4 |
|---|---|---|---|---|---|---|---|---|---|---|
| exported energy - electricityEEE | MJ | 0 | 0 | 6.26e-6 | 0 | 0 | 0 | 0 | 3.48e-1 | 0 |
| exported energy - heatEET | MJ | 0 | 0 | 1.02e-5 | 0 | 0 | 0 | 0 | 2.57e-1 | 0 |
| materials for energy recoveryMER | kg | 0 | 0 | 1.09e-1 | 0 | 0 | 0 | 0 | 2.06e+0 | 0 |
| materials for recyclingMFR | kg | 3.70e-2 | 0 | 2.27e+0 | 0 | 0 | 0 | 0 | 5.36e+0 | 0 |
| materials for net energy recovery (secondary fuels)MNER | kg | 0 | 0 | 0 | 0 | 0 | 0 | 0 | 0 | 0 |
| hazardous waste disposedHWD | kg | 0 | 0 | 0 | 0 | 0 | 0 | 0 | 0 | 0 |
| high-level radioactive waste disposedHLRW | kg | 3.17e-4 | 3.17e-6 | 5.46e-6 | 0 | 0 | 0 | 6.89e-8 | 3.67e-6 | 1.64e-7 |
| intermediate and low-level radioactive waste disposedILLRW | kg | 8.80e-4 | 7.66e-6 | 1.95e-5 | 0 | 0 | 0 | 1.66e-7 | 1.25e-5 | 4.13e-7 |
| non-hazardous waste disposedNHWD | kg | 0 | 0 | 4.35e-1 | 0 | 0 | 0 | 0 | 0 | 8.24e+0 |
| radioactive waste disposedRWD | kg | 1.20e-3 | 1.08e-5 | 2.49e-5 | 0 | 0 | 0 | 2.35e-7 | 1.62e-5 | 5.77e-7 |
| components for re-useCRU | kg | 0 | 0 | 0 | 0 | 0 | 0 | 0 | 0 | 0 |
Carbon Emissions and Removals
| Indicator | Unit | A1-A3 | A4 | A5 | B1 | B4 | C1 | C2 | C3 | C4 |
|---|---|---|---|---|---|---|---|---|---|---|
| Biogenic CO2, packagingBCRK | kg CO2 | -4.52e+0 | 0 | 0 | 0 | 0 | 0 | 0 | 0 | 0 |
| Biogenic CO2, packagingBCEK | kg CO2 | 0 | 0 | 4.52e+0 | 0 | 0 | 0 | 0 | 0 | 0 |
| Biogenic CO2, products | kg CO2 | 0 | 0 | 0 | 0 | 0 | 0 | 0 | 0 | 0 |
| CO2 from calcination and carbonation | kg CO2 | 0 | 0 | 0 | 0 | 0 | 0 | 0 | 0 | 0 |
| Biogenic Carbon, renewable waste combustion | kg CO2 | 0 | 0 | 0 | 0 | 0 | 0 | 0 | 0 | 0 |
| CO2 from non-renewable waste combustion | kg CO2 | 0 | 0 | 0 | 0 | 0 | 0 | 0 | 0 | 0 |
ND = not declared. Life cycle modules: A1-A3 product stage, A4-A5 construction process, B use stage, C end of life, D benefits and loads beyond the system boundary.
Material composition
| Material/Component Category | Origin | Mass (kg) | Percent of Product | Post-consumer % | Post-consumer weight (kg) | Pre-consumer % | Pre-consumer weight (kg) |
|---|---|---|---|---|---|---|---|
| ALUMINUM | Various | 4.686 | 29.92 | 0.0 | 0.00 | 81.6 | 3.82 |
| STEEL - (LOW-ALLOYED) | Various | 3.704 | 23.65 | 5.1 | 0.19 | 32.2 | 1.19 |
| POLYPROPYLENE | Various | 2.510 | 16.03 | 0.0 | 0.00 | 0.0 | 0.00 |
| NYLON 6, GLASS-FILLED | Various | 1.738 | 11.10 | 49.3 | 0.86 | 0.0 | 0.00 |
| POLYMERIC MATERIAL (POLYSTYRENE (PS)) | Various | 0.717 | 4.58 | 0.0 | 0.00 | 0.0 | 0.00 |
| NYLON 6 | Various | 0.669 | 4.27 | 47.7 | 0.32 | 0.0 | 0.00 |
| POLYURETHANE, FLEXIBLE FOAM, MDI-BASED | Various | 0.665 | 4.25 | 0.0 | 0.00 | 0.0 | 0.00 |
| POLYURETHANE FLEXIBLE FOAM | Various | 0.479 | 3.06 | 0.0 | 0.00 | 0.0 | 0.00 |
| POWDER COATING (ZINC PLATING) | Various | 0.115 | 0.73 | 0.0 | 0.00 | 0.0 | 0.00 |
| POLYOXYMETHYLENE (POM) | Various | 0.112 | 0.72 | 0.0 | 0.00 | 0.0 | 0.00 |
| ACRYLONITRILE BUTADIENE STYRENE (ABS) | Various | 0.086 | 0.55 | 0.0 | 0.00 | 0.0 | 0.00 |
| NYLON 6-6 | Various | 0.072 | 0.46 | 0.0 | 0.00 | 0.0 | 0.00 |
| BRONZE | Various | 0.063 | 0.40 | 89.1 | 0.06 | 0.0 | 0.00 |
| THERMOPLASTIC VULCANIZATES (TPV) | Various | 0.026 | 0.17 | 0.0 | 0.00 | 0.0 | 0.00 |
| NITRILE BUTADIENE RUBBER (NBR) | Various | 0.008 | 0.05 | 0.0 | 0.00 | 0.0 | 0.00 |
| LUBRICATING OIL | Various | 0.004 | 0.02 | 0.0 | 0.00 | 0.0 | 0.00 |
| POLYETHYLENE TEREPHTHALATE (PET) | Various | 0.004 | 0.02 | 0.0 | 0.00 | 0.0 | 0.00 |
| PHENOLIC RESIN | Various | 0.003 | 0.02 | 0.0 | 0.00 | 0.0 | 0.00 |
| Total | 15.661 | 100.00 | 9.1 | 1.42 | 32.0 | 5.02 |
| Packaging material | Origin | Mass (kg) |
|---|---|---|
| FOLDING BOXBOARD CARTON | New Jersey, United States | 2.8 |
| POLYETHYLENE (PE) | New Jersey, United States | 0.0091 |
| PACKAGING FILM, LOW DENSITY POLYETHYLENE | New Jersey, United States | 0 |
| Biogenic carbon content | kg C per Unit |
|---|---|
| Biogenic carbon content in product | 0 |
| Biogenic carbon content in accompanying packaging | 1.23 |
Hazardous substances
This product contains no substances required to be reported as hazardous to human health or the environment.
Scenarios
Transport to the building site (A4)
- Fuel type
- Diesel
- Vehicle type
- Fleet Average Lorry Class
- Transport distance
- 1250 km
- Weight of products transported
- 18.47 kg
End of life (C1-C4)
- Recycling
- 5.36 kg
- Landfill
- 8.24 kg
- Incineration with energy recovery
- 2.06 kg
Product description
The Freedom task chair revolutionizes the way people sit. With its weight-sensitive recline and synchronously adjustable armrests, it set new standards for task chair performance and functionality. With a sculpted foam backrest to match the contours of the human body and thick cushions for long lasting comfort, it provides a custom ergonomic fit for every user. The configuration modeled in this study is representative of a typical Freedom Task Chair with standard features, including a five-star plastic base with casters, standard cylinder, and armrests with foam padding. This configuration reflects the most common options specified by customers. The functional unit of the product is one unit of seating to seat a single occupant, maintained for a 10-yr period. The number of chairs required per functional unit is 1. In accordance with the PCR, the product has been certified to the ANSI/BIFMA X5.1 standard and therefore is deemed to meet the 10-yr service life. The category of the product is a Swivel/Task Chair intended for seating and mobile use within an office or workspace environment, with casters/rollers for movement per Option B of the PCR.
Interpretation
The Life Cycle Impact Assessment of Freedom Task offers a rigorous evaluation of its environmental footprint across key indicators—greenhouse gas emissions, energy use, and water depletion. The analysis reflects decisions already made during the design and development process to prioritize materials and manufacturing methods that align with sustainability objectives—balancing product performance with environmental responsibility.
Key Contributors to the environmental impact include the following:
Carbon Footprint: The top 3 activities contributing to carbon footprint (GWP total, IPCC AR6 GWP 100) are aluminium production, primary, ingot (18.0%), polypropylene production, granulate (7.1%), nylon 6 production, glass-filled (6.5%).
ADP-fossil: The top 3 activities contributing to fossil-resource depletion are polypropylene production, granulate (13.9%), aluminium production, primary, ingot (13.4%), injection moulding (7.5%).
Water Use: The top 3 activities contributing to fresh water use are nylon 6 production, glass-filled (17.1%), treatment of aluminium scrap, new, at remelter (10.1%), injection moulding (8.6%).
LCIA results are relative expressions and do not predict impacts on category endpoints, the exceeding of thresholds, safety margins or risks. EPDs are comparable only when they follow the same PCR, functional unit and system boundary. The full EPD (PDF) contains the methodology, scenario assumptions and verification statement.